Short-form Video’s Time To Shine

Short video is taking over the online world. It’s both beautiful and grim.

Everyday, online video is getting easier to access, and even easier to create. Because of apps like Vine and Instagram, videos are becoming one of the main reasons people even log onto the Internet. According to AdAge, over 40 million people are on Vine, while 150 million plus are on Instagram. That’s a lot of users.

Twitter and Facebook own Vine and Instagram respectively, and people are leaving the text-based social media for their quicker video counterparts. Pop culture has even seen these apps’ relevance. Trends, memes, slang, and even social groups have appeared from this medium. It’s truly marking its place in history, but why?

It’s because short video is both the fastest and the most alluring way to convey a message. If you manage to entertain your audience while telling them about your service or product, you’ve got a memorable and potentially viral advertisement on your hands. Major brands have been doing this for months now, be it the stop-motion animation of Dunkin Donuts’ paper flower or Trident Gum’s chewing-face close-ups!

That is where the beauty of accessibility to online video lies. Any person can make any video about anything. In fact, it is so easy that you could accidentally hit the record button while pulling your phone out of your pocket and make a short viral hit. It makes video accessible.

On the flip side though—it’s ruining our attention spans and giving us an unhealthy addiction to Internet’s speed. We’re becoming so accustomed to this short format, that anything over 30 seconds almost seems too long. People are clicking out of longer videos on YouTube, closing web pages that take too long to load, and going insane over buffering streaming content.
It’s hard to decide whether Vine and Instagram are helpful ways to communicate, or detrimental to our already short attention spans. Time will tell, as the number of users of these appsare predicted to grow even more in 2014.

Basic Guide to Predicting Adwords Conversions

The purpose of this blog is to provide an easy-to-understand and easy-to-use method of predicting conversions off of a chosen variable in an Adwords account.

Keep in mind – this is the simplest way, and therefore one of the less accurate. You’ll get a good estimate, but some more heavy lifting is needed to factor in the huge number of variables the average account has.

So, first thing first. Go to your Adwords account and export a report of weekly data for whatever ad group or campaign you’d like to predict. The more data you have the better (make sure to highlight the whole spreadsheet once it’s in excel, including headers, and select to format it as a table). Once you do this, you will have a spreadsheet that looks something like this:

(image has been blurred because contains client info)

(data has been blurred because of confidential client info)

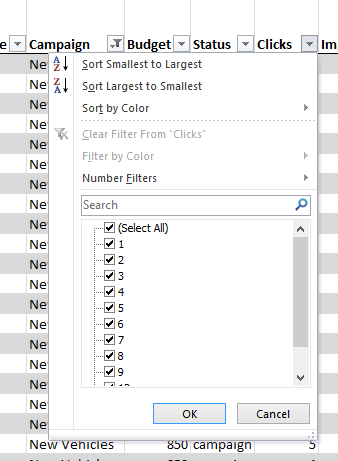
Now, from this spreadsheet go to the headers – they’ll be the top row, and select the arrow next to the filter that says “Clicks”.

joel2


Once you reach this menu, click “Sort Smallest to Largest” at the top. This will sort all of the data according to number of clicks.

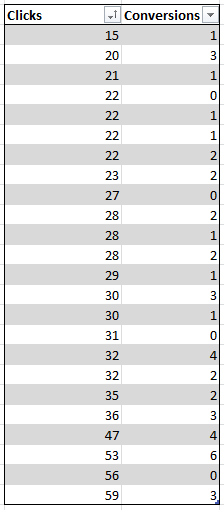
You will end up with a selection of data that looks something like this:

joel3


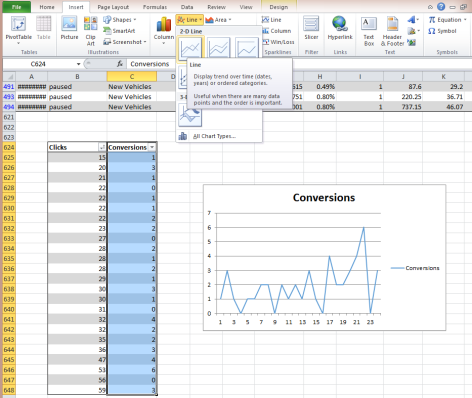
Once you have your variable and conversions data sorted properly, go ahead and make a line chart out of the conversion data. Just highlight the conversions data column, and click to insert Line Graph on the top right. Now you have a graph of conversions sorted by the number of clicks.

joel4


There are still a few more formatting things to be taken care of before we get to the predictive model.

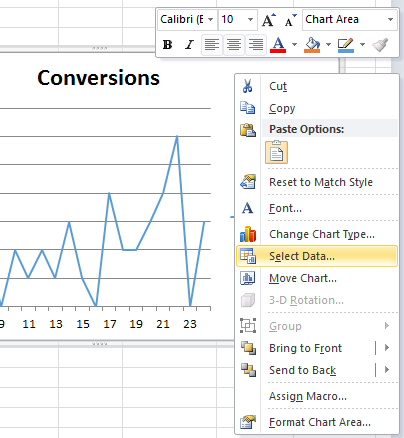
Right click your graph and hit select data:

joel5


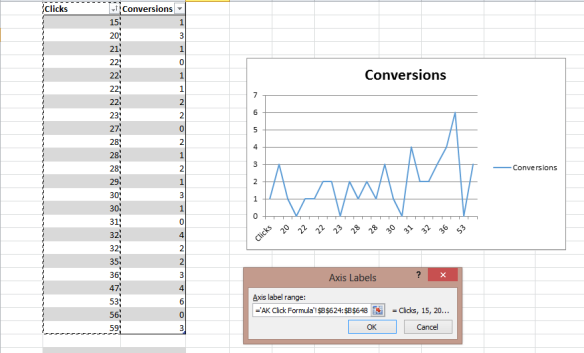
Once you get to the Select Data Source window, click Edit below the “Horizontal (Category) Axis Labels” title. From here, select your click data, which should already be sorted in ascending order like this:

joel6

Congratulations! Your graph is ready.

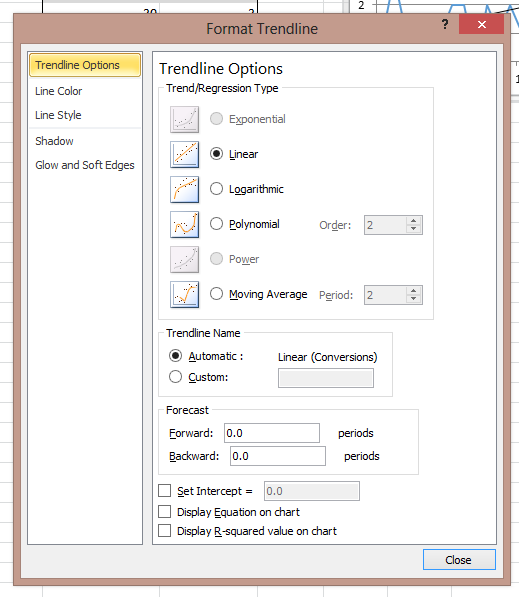
The next step is to insert the linear or exponential equation. To do this, right click on the line in your new graph and select “Add Trendline…”. You’ll see a window like this:

joel7

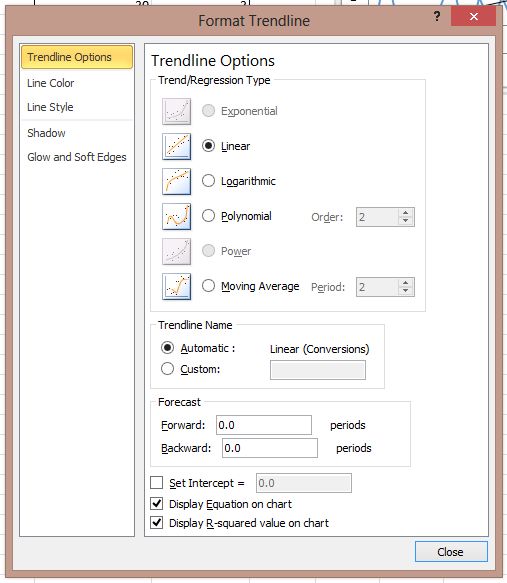
Select either Linear or Logarithmic, and select the “Display Equation” and “Display R-squared” boxes. Your window should look like this when you are finished:

joel8

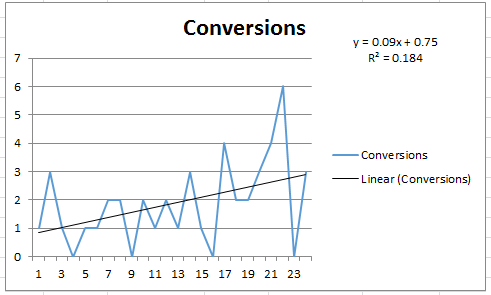
Okay! You now have your equation. Your graph will look like this now:

joel9


The Y= equation in the top right is your new predictive model. Simply plug how many conversions you want into the Y position, and solve for X. This will get you however many of X you need (within a range, of course) and help you plan your budgets alongside your goals.

The R2 value below the equation is a measure of the accuracy of the equation, see the Wiki. The higher this is the better. You see a lower R2 here because we’re only taking one variable into account.

Next, I’ll show you how to make it a simple tool in your spreadsheet so that you don’t have to solve the equation by hand every time you want to predict something.

There may be an easier way to get excel to solve your equation, but here’s how I do it. To restructure your equation, basically use your algebra skills to switch it around so X is on the left side. Mine looks like this:

Original: y=0.09x=0.75

Modified: x= (y-0.75)/0.09

Once you have that, you can make a table in excel where you can easily change your desired conversions and get an estimate on your variable.

Make a 2×2 table, one column is Conversions, the other is your variable (for me it’s Clicks). In the variable column, put in your modified equation, with Y being the cell under conversions. For the spreadsheet I’m using in this example, the cell under “Required Clicks” is “=(F645-0.75)/0.09”.

The results look like this:

joel10


- Joel (MOS Online Marketing Specialist)


Future Development – Google’s Acquisition of Nest

Evolution exists in all things, whether it’s reactive to environmental changes, a species’ need for survival, or the product of a situation that is strenuous. Evolution is also very visible within design globally, resulting from all three vanes of the aforementioned. The smart phone was a perfect example of a product that caused a demand that forced designers to evolve into another form or else they were seemingly not as relevant, nor would they be thriving. From Static design, to Interactive design, we as designers have had to grow in several ways, shedding the invaluable techniques of yesterday to grasp the new forms that growing demand has created. A recent acquisition by Google has sparked the recent thought that we as designers, as well as citizens, may be about to witness the next echelon.

In an article posted on Wired, they detail the pertinent as well as ephemeral effects of Google’s whopping $3.2 billion acquisition of Nest. In short, an inkling of the possibility of Google moving into more ambient hardware. Nest has a product titled “Nest Protect”, a simple smoke detector with a twist. Rather than a mundane household item that is more annoying than utilitarian, the alarm demonstrates more interactive capabilities that build an active memory and allow the hardware to react to the user, rather than the opposite. This design is ambient, responsive and extremely innovative. While not the most mind-altering invention of our time – it will bring about a new era of hardware. Once Google fully gains a grasp upon the creative capacity that this form of software melded into hardware can accomplish, I feel as if the dawn of a new design will be upon us.

Ambient Design will be at the core of nearly all integral hardware coming from Google. The hardware will begin with the responsive ideology from Nest’s household products, but now powered by the informational, intrapersonal titan that is Google. Google search engine already responds to your prior requests and queries based on past information. Hardware that is integrated with this evolving database of personal information could have us living in a network that slowly times itself to our tendencies. Answering questions before we ask, updating us before we show concern, creating an assistance system that will become second nature. Technology that is ambient will become integrated into our daily activities, rather than us taking time out to interact with the technology. Rather than us responding to our technology, technology will respond, live and learn beside us instead.

This core difference should allow us to live our lives without pausing constantly for our gadgetry, providing a more productive flow of activity. On the other hand, Google will have more influence on our life, as well as access to information on our daily living, which could make many consumers wary. Google will have to design a product and marketing campaign that is friendly, unassuming and unobtrusive in order to ease people into giving up their comforting level of privacy. Not only will the design have to be consistent, clean and minimal, it will also have to systemically provide a big enough improvement to the life of the average person for the reward to lighten the load of the daunting risks.

This begs the question: how does one design such a thing when there is no original source for reference? We will all soon see, because after Google announces their new wave of creation, along with its Google Glasses, Apple must produce a rebuttal which will lead to the next era of hardware for consumers. Not only will these changes alter daily life for everyone who can afford it, but the design world will forever change. We will have to attack problems from the view of the products’ response rather than the human’s response. We will have to create products that are humanly conscious while docile enough to not generate fear. A product or design that knows when to talk and when to listen. A product that observes without staring, that listens without hearing, a design that is so foreign to designers. We are used to responsive design that responds to the action of a human interaction with the product. Never has it been to the point where the product has to learn, as well as evolve new methods of interaction with its user.

These are all thoughts, nothing set in stone, but I hope these thoughts can be the stepping stones to question. To question what comes next in the path of evolution for the design world. I would love to hear anybody else’s thoughts on what they think Google’s acquisition means for the consumer as well as the design world. I believe the next step we take will be in unison and an exciting venture into the future.

- Jason (MOS Designer)


Visual Data Infographics


What does your business do? Why does the customer need it? Do they know that yet? Most importantly: Does your product/service need a simple, sharable, and visually awesome explanation? That’s where we come in, with infographics!


Infographics are used frequently all over the net. You’ve seen at least one. You can’t log into the internet without stepping across one. Maybe it was the awesome Batman one that was passed around twitter and Facebook for a couple of years now. That’s because it’s a great way to show data. It presents information in a beautiful, but purposeful and simple way. It serves two purposes—looks good and tricks you into learning. Those kind of go hand-in-hand.


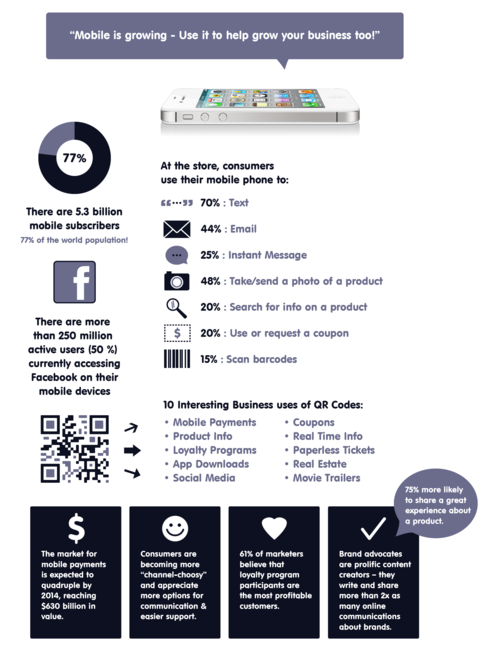
Here’s an example of one of the many infographics we’ve produced for our clients.

There are four ingredients that make up any successful infographic. These are Data, Design, Why, and Shareability. If it’s missing one of these elements, it won’t reach much of any audience. Think of it as a table… a table of info. If you remove a leg, you’re not gonna have an amazing table. Each aspect is essential. So don’t go without these four things:


Data:

It’s he backbone of the infographic. The entire reason you need one created is so you can display your data in an easy and simple way. You want everyone to understand. Data without the rest of the elements is boring, and flat out invisible to everyone. Gather your findings and be ready to have them represented in a beautiful fashion!


Why:

Well, you’ve got your data all ready to be shared, but what for? Say you’re looking to educate people on your product or service. You’d state a problem, and the purpose of the infographic is to explain how and why your business is the solution. Here’s where you make yourself important; here’s where you deliver your message.


Design:

Here’s where you take your what and why from above and make sense of it. Design puts everything in order and educates the viewer. Several points are to be touched upon: the information must be displayed clean and simple, it must look great so as to encourage reading, and there must be purpose to it. Meaning, you display your info in a fun, simple and creative manner that shows you know what you’re talking about. Bring eyes to your data.


Shareability:

Okay, your infographic is almost complete! What’s left to do is load it up with links to you and your social media outlets. You must let the viewer know where this image is coming from. Which brings us to a big decision: where do you put it? Of course you’re going to put it on your twitter and facebook, but where else? SEO will help, and as long as this is floating around the internet, it’ll grab eyes and bring attention to your business. So proper placement is key. Besides creating the infographic for you, we here at MOS are also able to put it in the right places.


Get a hold of us, and let’s visualize your data together!

-The MOS Creative Team

Check out our other Tumblr!

Coding an Entire WORLD

Websites, everyone’s got one, and we’re all familiar with the concept. But just how important is a new website? What are the new web trends of today, and why should my site utilize them?

We have a top-notch web developer on our team named Yuriy. We asked him what his favorite thing about his job was, and he said, “I think my favorite part is how you can make visual changes using code. You basically build an entire world. To me, that seems so powerful and beautiful at the same time. I love programming!”

With all the popular web trends to date, there are three in particular we’d like to highlight.

Parallax Sites:
The word “Parallax” comes from the animation world. It’s the name of the effect where background elements “move” in relation to the viewer. Think of driving along a hill and looking out the window. You’ll notice how things move at a different pace. Closer things zip by, where farther things seem to barely move. In the animation world, this creates an illusion of 3d space, and websites can have it too! It looks amazing, and it’s fun to navigate!

Responsive Sites:
Waaaay back in the olden times, there were things called “Desktop Sites” and “Mobile Sites”, which operated closely together, but still so very apart. “Ye olde two sites” is what I believe they called them. But these days, Responsive Sites do the job of both Desktop and Mobile. They’re sites that resize depending on the size of the browser it’s view upon—automatically! Essentially, you make one site that’s viewable from any platform you visit it from!

Improved Search Engine Marketing:
We have an SEO specialist, who acts as a ninja, implementing your site everywhere without a trace! You’ll show up higher in google searches, and will therefore be easier to find! His name is Joel. Call us today and see what he can do to make you appear in web searches!

Get a hold of us at MOS Creative, and we’ll help YOU stand OUT!


-The MOS Creative team

Reviews Matter

image

While you may feel your company/brand/service/product’s awesomeness speaks for itself, you’re only half right. Good work only goes so far. Online reviews, yeah those matter.

You’ve used Yelp once or twice before, right? You saw how useful of a tool it was and you found that sushi restaurant in record time! That was a good dinner too. Maybe you ought to review the place. A higher rating pushes them up on the list, bringing them more business and ensuring the chances that you’ll get that California roll again. After all, good ratings and reviews brought you there in the first place.

So you’ve seen firsthand how beneficial positive feedback can be. Why not for your business? Over 90% of people who’ve researched a business on Yelp agree that positive reviews lead to purchases. Check out this infographic from Mashable.

Being the 30th most visited site on the web, small businesses are the ones that benefit the most from Yelp’s exposure.  Increased customer awareness directly affects sales. Additionally, it’s a great way to get feedback from clients, with the ability to respond back to them! Create a dialogue! Seem like a business run by real people.

Though there is a bit of cautionary wisdom we’d like to bestow upon you: what’s worse than negative reviews are none at all. Don’t just start an account/claim your business on rating sites and let it sit stagnant. Actively encourage customers to leave reviews – there’s no downside to it. Perhaps you could get some inserts or packaging designed and printed to go along with your product, asking customers to write you a short review. In addition to Yelp maintenance, MOS Creative could design you up some snazzy printwork on top of it ;)

Get a hold of us at MOS Creative, and we’ll help YOU stand OUT!


-The MOS Creative team

Check out our Tumblr!

Throwback Thursday: Bumblejunk!

We work on many projects here at MOS Creative. Do you have too much clutter? Need it removed? Well, we know just the guys who will help you out with that. This week, we want to highlight one of our favorites: Bumblejunk Junk Removal!

We’ve created many things for these guys. Here, we’ve got businesscards, yard signs, postcards, a vehicle wrap, and even an animation that ran on television!

We did all the work in-house, utilizing one of our designers, John as the voice. Tony then animated it all together. This was super fun.

The businesscards were a fun project as well. Here’s the front:image

And here’s the back:
image

We love how well the light blue and the bright, vibrant yellow play off of each other. 

While the Bumblejunk guys are out at a house, removing junk as they do, they place a nice sign in the lawn.

image

Bright, happy, and hard to miss!

The residential postcards were also a treat to make:

image

As we see in this postcard, there’s a Bumblejunk vehicle driving around. Here’s our vehicle wrap design!

image

We had a ton of fun creating this. Give Bumblejunk a call today!

-The MOS Creative Team

Check out our blog!

Behind the Scenes: Foodem.com

We here at MOS Creative have done many projects, and here’s one of our recent ones, an animation for Foodem.com!

Our animator, Tony, cranked away at this animation. Here are some sketches of the chef character:

image

None of these made the cut

image

As you can see, our winning chef was born here! Tony then took this design, and made a full body. Then, the phonemes, or mouth motions had to be made. Here is a sketch sheet of the “happy” phonemes used in the animation:

image

These were all scanned in and drawn over in Adobe Flash. The animation was then completed with this full motion puppet!

This is just one of the animations we’ve made. We here at MOS Creative are capable of many different styles of animation/film/video and any other motion graphics projects you’d ever want! Remember our slogan: “We help YOU Stand out!” and that we do.

-The MOS Creative Team

check our our other blog, at moscreative.tumblr.com!

Do Grades Matter After College?

Discussing if your GPA matters or not when interviewing for jobs is a sensitive subject that receives a lot of (dare I say) heated discussion. In my humble opinion, at the end of the day, your GPA should not hold a great amount of weight when applying for a job or internship, and here’s why:

If an applicant has a 4.0 GPA, that’s great. However, in the world of marketing and public relations, will the GPA still matter if the applicant doesn’t know how to effectively communicate ideas and show that they think outside the box?

While interviewing for various internships throughout the years, I’ve never been asked about my GPA. I’m not trying to advise any readers to slack off now — it’s always important to work hard in school. (Your grades will decide if you graduate or not!) However, if you’re planning on applying to jobs right after college, it would be helpful not to stress too much about your GPA. In other words, your GPA will not be the single deciding factor when applying for jobs.

What will determine it? The ideas you have to offer, and your willingness to pull through with them! Creativity, relevant experience, networking and time management are also important. Speaking skills are also helpful.

Another crucial skill today is writing. With today’s technology that lets us rapidly communicate in short bursts of information, the emphasis to thoroughly express one’s thoughts has deteriorated. I believe employers are looking for the few people who can creatively and effectively communicate ideas through writing.

What else matters besides GPA? Does GPA have more importance than I make it out to be?