What does your business do? Why does the customer need it? Do they know that yet? Most importantly: Does your product/service need a simple, sharable, and visually awesome explanation? That’s where we come in, with infographics!
Infographics are used frequently all over the net. You’ve seen at least one. You can’t log into the internet without stepping across one. Maybe it was the awesome Batman one that was passed around twitter and Facebook for a couple of years now. That’s because it’s a great way to show data. It presents information in a beautiful, but purposeful and simple way. It serves two purposes—looks good and tricks you into learning. Those kind of go hand-in-hand.
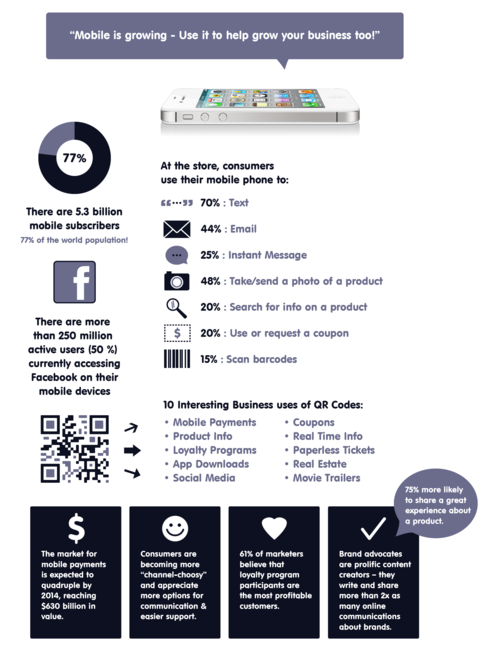
Here’s an example of one of the many infographics we’ve produced for our clients.
There are four ingredients that make up any successful infographic. These are Data, Design, Why, and Shareability. If it’s missing one of these elements, it won’t reach much of any audience. Think of it as a table… a table of info. If you remove a leg, you’re not gonna have an amazing table. Each aspect is essential. So don’t go without these four things:
Data:
It’s he backbone of the infographic. The entire reason you need one created is so you can display your data in an easy and simple way. You want everyone to understand. Data without the rest of the elements is boring, and flat out invisible to everyone. Gather your findings and be ready to have them represented in a beautiful fashion!
Why:
Well, you’ve got your data all ready to be shared, but what for? Say you’re looking to educate people on your product or service. You’d state a problem, and the purpose of the infographic is to explain how and why your business is the solution. Here’s where you make yourself important; here’s where you deliver your message.
Design:
Here’s where you take your what and why from above and make sense of it. Design puts everything in order and educates the viewer. Several points are to be touched upon: the information must be displayed clean and simple, it must look great so as to encourage reading, and there must be purpose to it. Meaning, you display your info in a fun, simple and creative manner that shows you know what you’re talking about. Bring eyes to your data.
Shareability:
Okay, your infographic is almost complete! What’s left to do is load it up with links to you and your social media outlets. You must let the viewer know where this image is coming from. Which brings us to a big decision: where do you put it? Of course you’re going to put it on your twitter and facebook, but where else? SEO will help, and as long as this is floating around the internet, it’ll grab eyes and bring attention to your business. So proper placement is key. Besides creating the infographic for you, we here at MOS are also able to put it in the right places.
Get a hold of us, and let’s visualize your data together!
-The MOS Creative Team
Check out our other Tumblr!


