Basic Guide to Predicting Adwords Conversions

The purpose of this blog is to provide an easy-to-understand and easy-to-use method of predicting conversions off of a chosen variable in an Adwords account.

Keep in mind – this is the simplest way, and therefore one of the less accurate. You’ll get a good estimate, but some more heavy lifting is needed to factor in the huge number of variables the average account has.

So, first thing first. Go to your Adwords account and export a report of weekly data for whatever ad group or campaign you’d like to predict. The more data you have the better (make sure to highlight the whole spreadsheet once it’s in excel, including headers, and select to format it as a table). Once you do this, you will have a spreadsheet that looks something like this:

(image has been blurred because contains client info)

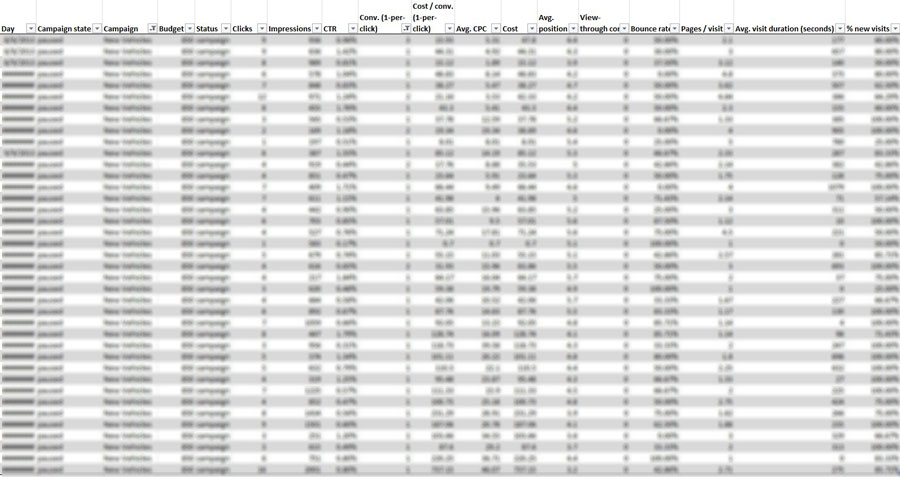
(data has been blurred because of confidential client info)

Now, from this spreadsheet go to the headers – they’ll be the top row, and select the arrow next to the filter that says “Clicks”.

joel2


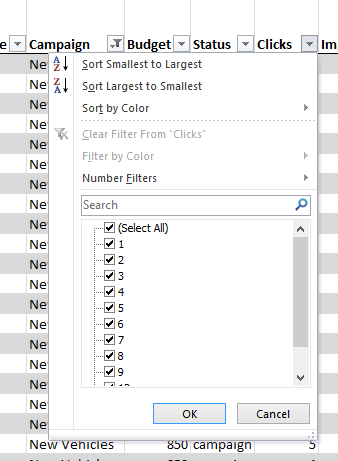
Once you reach this menu, click “Sort Smallest to Largest” at the top. This will sort all of the data according to number of clicks.

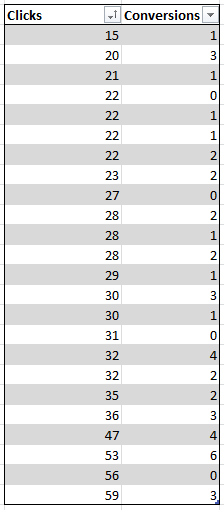
You will end up with a selection of data that looks something like this:

joel3


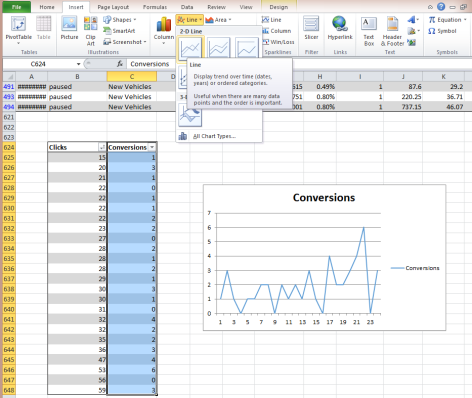
Once you have your variable and conversions data sorted properly, go ahead and make a line chart out of the conversion data. Just highlight the conversions data column, and click to insert Line Graph on the top right. Now you have a graph of conversions sorted by the number of clicks.

joel4


There are still a few more formatting things to be taken care of before we get to the predictive model.

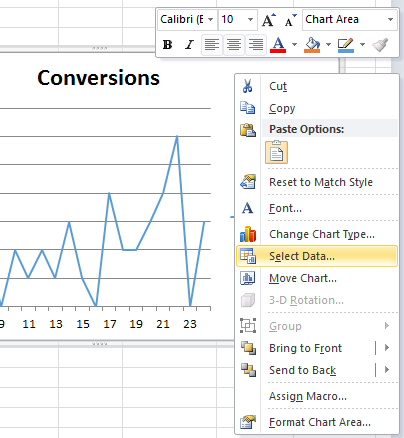
Right click your graph and hit select data:

joel5


Once you get to the Select Data Source window, click Edit below the “Horizontal (Category) Axis Labels” title. From here, select your click data, which should already be sorted in ascending order like this:

joel6

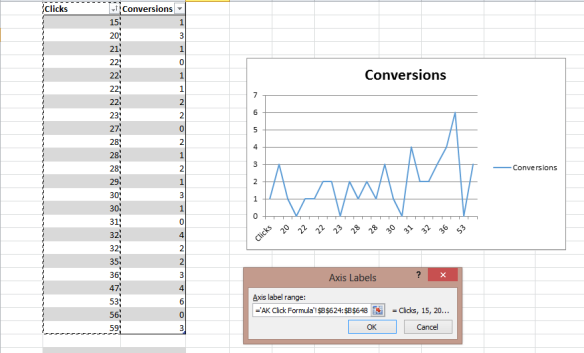
Congratulations! Your graph is ready.

The next step is to insert the linear or exponential equation. To do this, right click on the line in your new graph and select “Add Trendline…”. You’ll see a window like this:

joel7

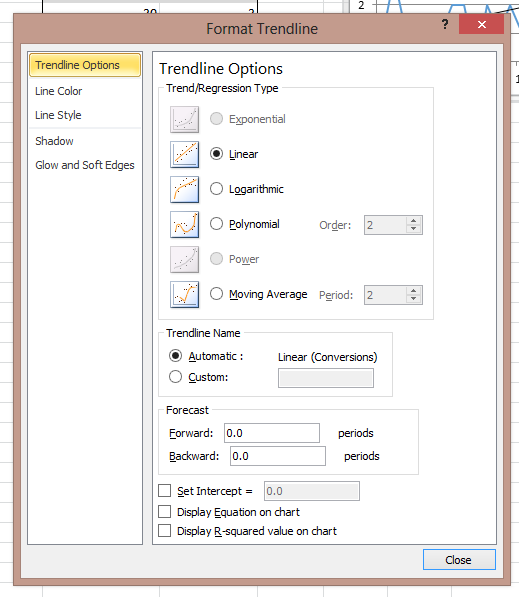
Select either Linear or Logarithmic, and select the “Display Equation” and “Display R-squared” boxes. Your window should look like this when you are finished:

joel8

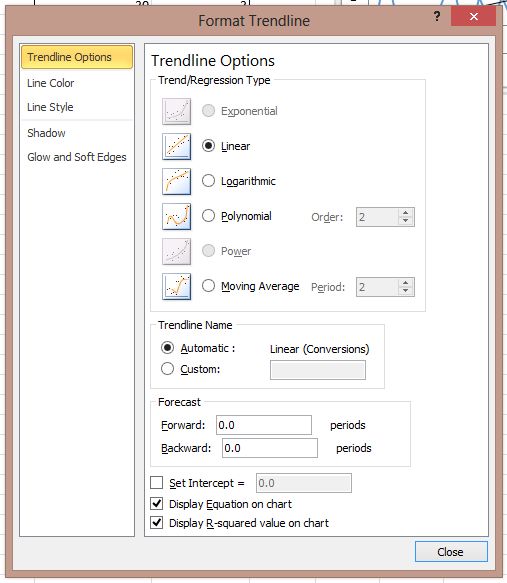
Okay! You now have your equation. Your graph will look like this now:

joel9


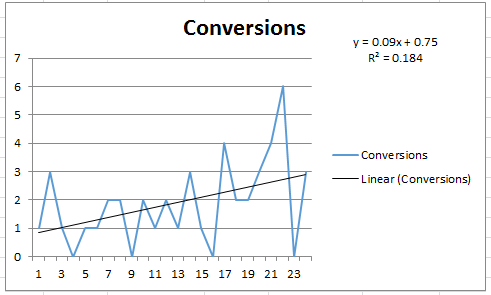
The Y= equation in the top right is your new predictive model. Simply plug how many conversions you want into the Y position, and solve for X. This will get you however many of X you need (within a range, of course) and help you plan your budgets alongside your goals.

The R2 value below the equation is a measure of the accuracy of the equation, see the Wiki. The higher this is the better. You see a lower R2 here because we’re only taking one variable into account.

Next, I’ll show you how to make it a simple tool in your spreadsheet so that you don’t have to solve the equation by hand every time you want to predict something.

There may be an easier way to get excel to solve your equation, but here’s how I do it. To restructure your equation, basically use your algebra skills to switch it around so X is on the left side. Mine looks like this:

Original: y=0.09x=0.75

Modified: x= (y-0.75)/0.09

Once you have that, you can make a table in excel where you can easily change your desired conversions and get an estimate on your variable.

Make a 2×2 table, one column is Conversions, the other is your variable (for me it’s Clicks). In the variable column, put in your modified equation, with Y being the cell under conversions. For the spreadsheet I’m using in this example, the cell under “Required Clicks” is “=(F645-0.75)/0.09”.

The results look like this:

joel10


- Joel (MOS Online Marketing Specialist)


Visual Data Infographics


What does your business do? Why does the customer need it? Do they know that yet? Most importantly: Does your product/service need a simple, sharable, and visually awesome explanation? That’s where we come in, with infographics!


Infographics are used frequently all over the net. You’ve seen at least one. You can’t log into the internet without stepping across one. Maybe it was the awesome Batman one that was passed around twitter and Facebook for a couple of years now. That’s because it’s a great way to show data. It presents information in a beautiful, but purposeful and simple way. It serves two purposes—looks good and tricks you into learning. Those kind of go hand-in-hand.


Here’s an example of one of the many infographics we’ve produced for our clients.

There are four ingredients that make up any successful infographic. These are Data, Design, Why, and Shareability. If it’s missing one of these elements, it won’t reach much of any audience. Think of it as a table… a table of info. If you remove a leg, you’re not gonna have an amazing table. Each aspect is essential. So don’t go without these four things:


Data:

It’s he backbone of the infographic. The entire reason you need one created is so you can display your data in an easy and simple way. You want everyone to understand. Data without the rest of the elements is boring, and flat out invisible to everyone. Gather your findings and be ready to have them represented in a beautiful fashion!


Why:

Well, you’ve got your data all ready to be shared, but what for? Say you’re looking to educate people on your product or service. You’d state a problem, and the purpose of the infographic is to explain how and why your business is the solution. Here’s where you make yourself important; here’s where you deliver your message.


Design:

Here’s where you take your what and why from above and make sense of it. Design puts everything in order and educates the viewer. Several points are to be touched upon: the information must be displayed clean and simple, it must look great so as to encourage reading, and there must be purpose to it. Meaning, you display your info in a fun, simple and creative manner that shows you know what you’re talking about. Bring eyes to your data.


Shareability:

Okay, your infographic is almost complete! What’s left to do is load it up with links to you and your social media outlets. You must let the viewer know where this image is coming from. Which brings us to a big decision: where do you put it? Of course you’re going to put it on your twitter and facebook, but where else? SEO will help, and as long as this is floating around the internet, it’ll grab eyes and bring attention to your business. So proper placement is key. Besides creating the infographic for you, we here at MOS are also able to put it in the right places.


Get a hold of us, and let’s visualize your data together!

-The MOS Creative Team

Check out our other Tumblr!

Coding an Entire WORLD

Websites, everyone’s got one, and we’re all familiar with the concept. But just how important is a new website? What are the new web trends of today, and why should my site utilize them?

We have a top-notch web developer on our team named Yuriy. We asked him what his favorite thing about his job was, and he said, “I think my favorite part is how you can make visual changes using code. You basically build an entire world. To me, that seems so powerful and beautiful at the same time. I love programming!”

With all the popular web trends to date, there are three in particular we’d like to highlight.

Parallax Sites:
The word “Parallax” comes from the animation world. It’s the name of the effect where background elements “move” in relation to the viewer. Think of driving along a hill and looking out the window. You’ll notice how things move at a different pace. Closer things zip by, where farther things seem to barely move. In the animation world, this creates an illusion of 3d space, and websites can have it too! It looks amazing, and it’s fun to navigate!

Responsive Sites:
Waaaay back in the olden times, there were things called “Desktop Sites” and “Mobile Sites”, which operated closely together, but still so very apart. “Ye olde two sites” is what I believe they called them. But these days, Responsive Sites do the job of both Desktop and Mobile. They’re sites that resize depending on the size of the browser it’s view upon—automatically! Essentially, you make one site that’s viewable from any platform you visit it from!

Improved Search Engine Marketing:
We have an SEO specialist, who acts as a ninja, implementing your site everywhere without a trace! You’ll show up higher in google searches, and will therefore be easier to find! His name is Joel. Call us today and see what he can do to make you appear in web searches!

Get a hold of us at MOS Creative, and we’ll help YOU stand OUT!


-The MOS Creative team

Adwords for Local Businesses: How to use Extensions and the new Google Maps for better conversion rates.

Google Adwords has a couple of functions we are highlighting called Local Extensions as well as the new Adwords for Google Maps which are going to be great for local businesses looking to cut through.

As the Google ad says, “Who is looking for a mechanic in your town? Someone Googling for a mechanic in your town.” (Or something to that effect.).

This sets the premise for how Adwords can help a local business. With somewhere between 80% and 90% of searches for products starting online, it’s important for small businesses to be where their customers are looking.

The days of direct mailers, Val-Pak and Yellow Pages advertising are fast fading and local businesses are moving online where their customers are looking for them.

The basics of Adwords are pretty simple, if you are in Columbia, Maryland and someone searches “Columbia Pest Control” in Google an ad of yours will show up with people’s results. One nice thing, unlike most other forms of advertising is that you only pay when someone actually clicks on your ad It’s a very measurable form of advertising which only hits people who are looking for you.

With that basic understanding, there are a couple of important functions which can really push traffic and conversions (Sales!) which are worth taking a closer look at.

Local Extensions::

If you take a look at a search in your field you will probably notice a lot of national companies and people you may not have heard of. Your customers will see that too. Now what you can do to set yourself apart is set up something called a local extension. It looks like this:

Local Extensions example!

Local Extensions show searchers where you are.

Basically what it does is for someone who is near you and searching, it will display you businesses contact info to show them that you are local and nearby, therefore letting you cut through some of the noise and get them to call in or come to your location with minimal clicking around and effort.

Google Maps:

An exciting new feature coming to Google maps is that Adwords will soon be able to be displayed on Google Maps.
To clarify, one of the ways people search is that they go to Google Maps and type in “Sushi Restaurant” and see what locations pop up on the map around them.
It would look something like this:

Current Gmaps.

Current Google maps, a bit cluttered, no ads.

Now, the news here is that Google just announced some changes that will take the results from that, to this:

Good news for Adwords!

Much cleaner, with prominent Adwords.

As you can see, the new interface is much cleaner with a lot less information. What is visible, most importantly to this post is that Adword ad for Sakura Sushi.

So now when your customers are looking for a Sushi place through their maps, you can once again cut through the noise and get your message in front of them so that you are the place they call to make a reservation, or to come in for a meal.

There are many ways to take advantage of the power of Adwords, these are just a few of our favorites for local business.

If you are a local business trying to get a leg up in your area, give us a call, we’d love to help out. Leave a comment below with any questions or comments and we’ll respond as quickly as possible.

You can check out our website at www.MOSCreative.com.

Joel

Things I’ve Learned During My Internship

Why hello there!

I started my communications internship here at MOS Creative at the beginning of January. When I started, I wasn’t familiar with the term SEO, I had never interviewed a client, my writing skills needed to improve, and I never truly felt like I was a part of a team at any workplace – until I started here.

Even though I have only been here for a couple of months, I’ve learned so much! Here are just a few key tips I’ve acquired so far:

- SEO: Google it, learn about it, embrace it! It is very important to know about certain key terms that can affect the visibility of your site. I believe any traffic is important.

- Ask questions. Don’t be afraid to bother your supervisors when you are given a task you may not understand 100%. Remember: it’s part of their job to help you learn and grow!

- Admit when you’re wrong. Mistakes happen. They’re a part of life, and they’re especially a part of the workplace. If you’ve made a mistake, don’t point fingers or play the blame game. Taking responsibility for your actions in the workplace takes a great amount of courage and bravery.

- Do your research. If you have spare time at work, look up websites that are related to your field of interest. Devour as much information as you can.

Lastly, go with your gut. I know this is something you may here often, but there are going to be many occurrences in which you’ll have to make a big decision on something that is work-related.

These short (but useful!) tips should take you far in the workplace – it has for me!

Laura

What it takes to be Steve Jobs

“Why join the navy when you can be a pirate?” Wiser words never uttered by a man more influential and responsible for single-handedly transforming the computing and mobile landscape.

Steve Jobs told us to be crazy. He told us he wanted to put a ding in the universe. He didn’t put a ding, but he sure left an Apple.

A single glance at the non-stop media coverage, and you’d think America’s greatest superhero finally befell to his kryptonite. #SteveJobs, #iSad and #ThankYouSteve rotate Twitter’s trending topics, and pictures of our generation’s Thomas Edison continue to flood Facebook’s news feeds.

But in no jest, he was a hero to millions, probably billions, of people he never met. He changed the way we think about and interact with the world. Every time you have to ask your kid a computer question, remember, he’s the reason.

Continue reading

Back to Basics: What is your Marketing Objective?

When it comes to this whole marketing thing, do you sometimes feel like you’re in over your head? Maybe you’re new to the “branding” concept? You hear so much talk about “engaging your audience” via Facebook and social media, but are you completely lost in where to even start?

I’m not surprised. Go ahead, just try Googling “marketing ideas.” You’ll get 40,200,000 search results.

Talk about information overload. No wonder most business owners don’t even want to think about their marketing, so they put it off for as long as possible. I’m thinking you need a little direction. Am I right?

I’m gonna level with you – doing it right is not as easy as it looks. That’s why there are millions of professional marketing firms out there. And for the most part, the professionals will do a good job for you. But whether you’re coming up with the creative ideas, or you’re paying someone else to do it for you, you should NEVER go into your own marketing strategy blindly. It’s EXTREMELY important that you get involved. After all, who knows your clients, your product and your company’s needs and goals better than you do?

So before you delve into the details of how often to Tweet and which keywords to base your SEO around, let’s start with the basics. I just want to get your feet wet and get you thinking. Always start by figuring out what your marketing OBJECTIVE is. Everything else will come from there.

What’s your Objective?

1. Awareness – Potential customers must know of, or be reminded of your existence, your location, your product, your price range, and what makes you stand out from the competition

2. Build Contact List – Your mailing list is like gold. It’s what you rely on for promoting any campaign, and it takes a lot of nurturing to build and keep.

3. Get Involved – Your business is not soul-less. Companies are made up of people, and people like to patronize companies that they know go out of their way to help other people. Your company’s positive image reinforces the perception that you are genuinely caring and sharing.

4. Staff Incentives – A cared for and happy team makes for a harmonious, smooth operation. Customers can tell when your employees don’t want to be there. Think about the grouchy, frowning cashier at the supermarket. Make sure your employees feel appreciated!

5. Excitement – This is the kind of energy and excitement that makes you stand out from the competition. This is when you need to turn on your thinking cap and come up with some really creative promotions.

6. Frequency – When you’re trying to be “the place to go.” This is a brand loyalty thing, and keeping them coming as frequently as possible.

7. Publicity – For this one you’ve got to be interesting and newsworthy. Maybe you’re doing BIG things for the community, or you’re doing something so completely out of the box that it’s a story too good to pass up.

8. Generate Traffic - Simply getting people in the door or on the website is your goal here. Contests are great for this! You want to get potential customers to complete some sort of action, whether it’s entering the contest or downloading a form.

9. Branding – Image is everything. Period. If you don’t define your company and your brand, the market will define it for you. And that’s never what you want!

10. Increase Sales – a.k.a. Up-selling – This is every CEO’s favorite! From the sneaky but ingenious psychological tactics (a la putting candy, gum and magazines in the grocery checkout line) to having an in-depth understanding of how your industry works, there are really unlimited opportunities to do this one.

11. Creating Activity - Most industries have their “slow” periods during the year, but that’s not set in stone. This is where you will get creative to make the slow season profitable.

12. Trial Offer – Who’s gonna turn down a free sample? Come on, you’ll love it. This is when you really want to get those potential customers who are living on the edge to finally make the plunge – but without any of the risk.

(Great list compiled by Tom Feltenstein – And if you’re looking for a good book on the basics, try Tom’s “Encyclopedia of 401 Proven Killer Promotional Tactics”)